
Bitcoin and select altcoins are starting to recover, but selling at the top of each price breakout suggests that bears remain in control.
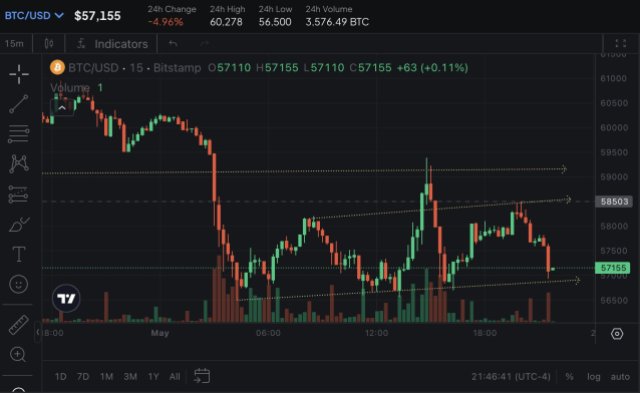
After its sharp fall on Aug. 17, Bitcoin remained stuck inside a tight range over the weekend. This suggests indecision between the bulls and the bears about the next directional move.
After the latest fall, about 88% of Bitcoin (BTC) held by short-term holders (STHs), those owning Bitcoin for 155 days or less, has plunged into loss, according to Glassnode’s weekly newsletter, “The Week On-Chain.” Glassnode warns that the STH cohort is “increasingly price sensitive.”
In comparison, the long-term holders have neither panicked nor gone on a shopping spree during the current fall.

Traders are likely to keep a close watch on Federal Reserve Chairman Jerome Powell’s speech at the annual Jackson Hole Economic Symposium on Aug. 25. If Powell does not spring a negative surprise, then the event may turn out to be bullish for risky assets. History suggests that U.S. stocks generally rise in the week after Jackson Hole.
What are the important support and resistance levels to watch for in Bitcoin and altcoins? Let’s analyze the charts to find out.
S&P 500 Index price analysis
The S&P 500 Index (SPX) is correcting in an uptrend. Typically pullbacks are a buying opportunity in an uptrend, but it is prudent to wait for the correction to end before resuming the purchases.

The price has reached the breakout level of 4,307, which is an important level to keep an eye on. The moving averages are on the verge of a bearish crossover, and the relative strength index (RSI) is in negative territory, indicating that bears are trying to seize control.
A bounce off the current level is again likely to face selling at the moving averages. If the price turns down from the moving averages, the index will be at risk of forming a bearish head-and-shoulders pattern.
On the contrary, a rally above the moving averages will indicate that the corrective phase may be over.
U.S. Dollar Index price analysis
The U.S. Dollar Index (DXY) recovered to the downtrend line, where the bears are posing a strong challenge. However, the index has not lost ground, indicating that the bulls have kept up the buying pressure.

If buyers propel the index above the downtrend line, it will suggest that the bears are losing their grip. The index could then resume its recovery and reach the stiff overhead resistance at 106. This level is again likely to attract strong selling by the bears.
The moving averages are the important support to watch out for on the downside. The bears will have to sink the price below the 50-day simple moving average (SMA) at 102 to signal a comeback. That could open the doors for a retest of the strong support near 101.
Bitcoin price analysis
Bitcoin has been consolidating inside a large range between $24,800 and $31,000 for the past several weeks. Inside a range, traders buy the dips to the support and sell near the overhead resistance. In between, trading may be random and volatile.

The moving averages have turned down and the RSI is in the oversold territory, indicating that bears are firmly in control. Sellers will try to build upon their advantage by yanking the price below $24,800, but the bulls are unlikely to give up easily.
The buyers will try to start a recovery from the support, which is likely to pick up momentum above $26,833. The BTC/USDT pair may then rise to the 20-day exponential moving average (EMA) at $28,098, signaling that the range-bound action remains intact.
Ether price analysis
Ether’s (ETH) bounce is struggling to rise above $1,700, indicating that the bears have not given up and are selling on minor rallies.

A shallow bounce usually indicates a lack of urgency among the bulls to buy. That increases the risk of a breakdown below the support. If the price turns down and slips below $1,626, it will suggest that bears remain in command. The ETH/USDT pair may then retest the intraday low of $1,550 made on Aug. 17.
Contrarily, if the price turns up from the current level and rises above $1,700, it will suggest the start of a stronger recovery. The first stop may be the 20-day EMA ($1,777), but if this level is crossed, the pair may reach the 50-day SMA ($1,852).
BNB price analysis
BNB (BNB) tumbled below the vital support at $220 on Aug. 17, and the bears have managed to defend the level since then. This suggests that the bears are trying to flip the $220 level into resistance.

The price crashed below the immediate support at $212 on Aug. 21, indicating the resumption of the downtrend. The BNB/USDT pair could first plummet to the pattern target of $196 and eventually to the next major support at $183.
Time is running out for the bulls. If they want to salvage the situation, they will have to quickly drive and sustain the price above $220. The pair could then rise to the 20-day EMA ($230), which may again act as a stiff barrier.
XRP price analysis
XRP (XRP) bounced off the strong support at $0.41 on Aug. 17 and reached the overhead resistance at $0.56 on Aug. 20.

The bears are trying to stall the relief rally near $0.56, indicating that the sentiment remains negative and traders are selling on every minor rise. If the price turns down and skids below $0.48, it will suggest that the XRP/USDT pair may swing between $0.41 and $0.56 for a few days.
The downsloping 20-day EMA ($0.59) and the RSI near the oversold zone signal that bears have the edge. The first sign of strength will be a break and close above the 20-day EMA. That will indicate that the bearish pressure may be reducing.
Cardano price analysis
Cardano (ADA) snapped back from the crucial support at $0.24 on Aug. 17, but the relief rally is facing downward pressure at the overhead resistance near $0.28.

The downsloping 20-day EMA ($0.28) and the RSI in the negative area suggest that bears have the upper hand. If the price slips below $0.26, it will indicate that the ADA/USDT pair may oscillate inside the tight range between $0.24 and $0.28 for a while longer.
Generally, a tight consolidation near a strong support level is a negative sign, and it may result in a breakdown. If the $0.24 support gives way, the pair may plunge to $0.22 and then to $0.20. If buyers want to prevent the decline, they will have to quickly thrust the price above the moving averages.
Related: Binance limits withdrawals in Europe, cites payment processor issues
Dogecoin price analysis
The bulls have managed to keep Dogecoin (DOGE) above the essential support at $0.06 for the past few days, but they have failed to start a strong bounce.

The shallow bounce suggests a negative sentiment where the bulls are not buying aggressively. This may have encouraged the bears to seize control, and they have pulled the price to the strong support at $0.06.
If the price breaks below $0.06, the DOGE/USDT pair could nosedive toward the next solid support near $0.05. Alternatively, if the price turns up from the current level, it will indicate that lower levels are attracting buyers. The pair may then climb to the moving averages. A break above the 50-day SMA ($0.07) could start a sustained recovery.
Solana price analysis
Solana (SOL) bulls are facing stiff resistance from the bears near the overhead resistance at $22.30. This suggests that the bears are trying to flip the $22.30 level into resistance.

The moving averages have completed a bearish crossover and the RSI is in the negative zone, indicating that bears have the edge. The SOL/USDT pair could retest the support at $20. If this level gives way, the pair may start a deeper correction to $18 and subsequently to $15.60.
If the bulls want to make a comeback, they will have to kick the price above the moving averages. It is going to be a tough ask, but if they manage to do it, the pair may rally to the overhead resistance zone between $26 and $27.12.
Polkadot price analysis
Polkadot (DOT) formed a Doji candlestick pattern on Aug. 19 and 20, indicating that the buying pressure has been reducing.

If the price continues lower and breaks below $4.36, it will suggest that bears are trying to gain the upper hand. The DOT/USDT pair could then retest the pivotal support at $4.22. If this level caves in, the selling may accelerate and the pair could start the next leg of the downtrend.
Conversely, if the price turns up and breaks above $4.56, it will suggest that bulls are making a comeback. The pair could then rally to the 20-day EMA ($4.79), which is again likely to behave as a roadblock.

You can get bonuses upto $100 FREE BONUS when you:
💰 Install these recommended apps:
💲 SocialGood - 100% Crypto Back on Everyday Shopping
💲 xPortal - The DeFi For The Next Billion
💲 CryptoTab Browser - Lightweight, fast, and ready to mine!
💰 Register on these recommended exchanges:
🟡 Binance🟡 Bitfinex🟡 Bitmart🟡 Bittrex🟡 Bitget
🟡 CoinEx🟡 Crypto.com🟡 Gate.io🟡 Huobi🟡 Kucoin.


Comments